If you are reading this, you are probably a Web Developer and, on that assumption, I’m going to go out on a limb and guess you’ve heard about Visual Studio Code by now, you may even be currently using it for your development work.
Here is a list of 10 must-have Visual Studio Code extensions to boost productivity, code quality, and collaboration.
Installing extensions
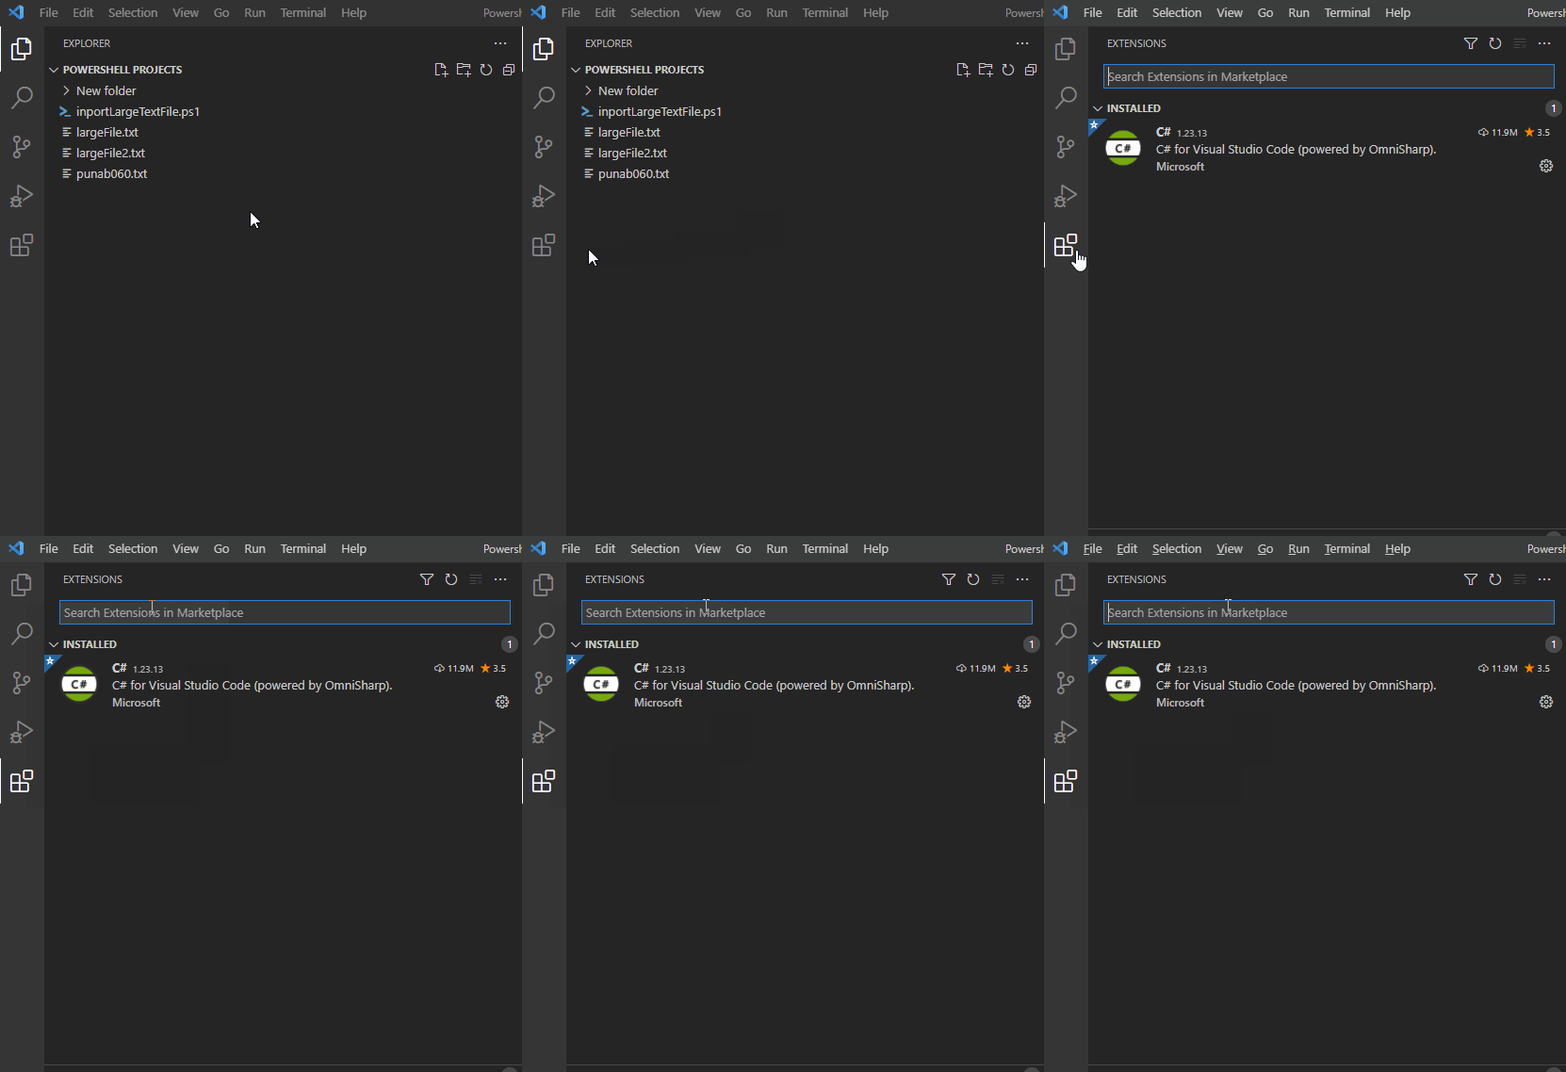
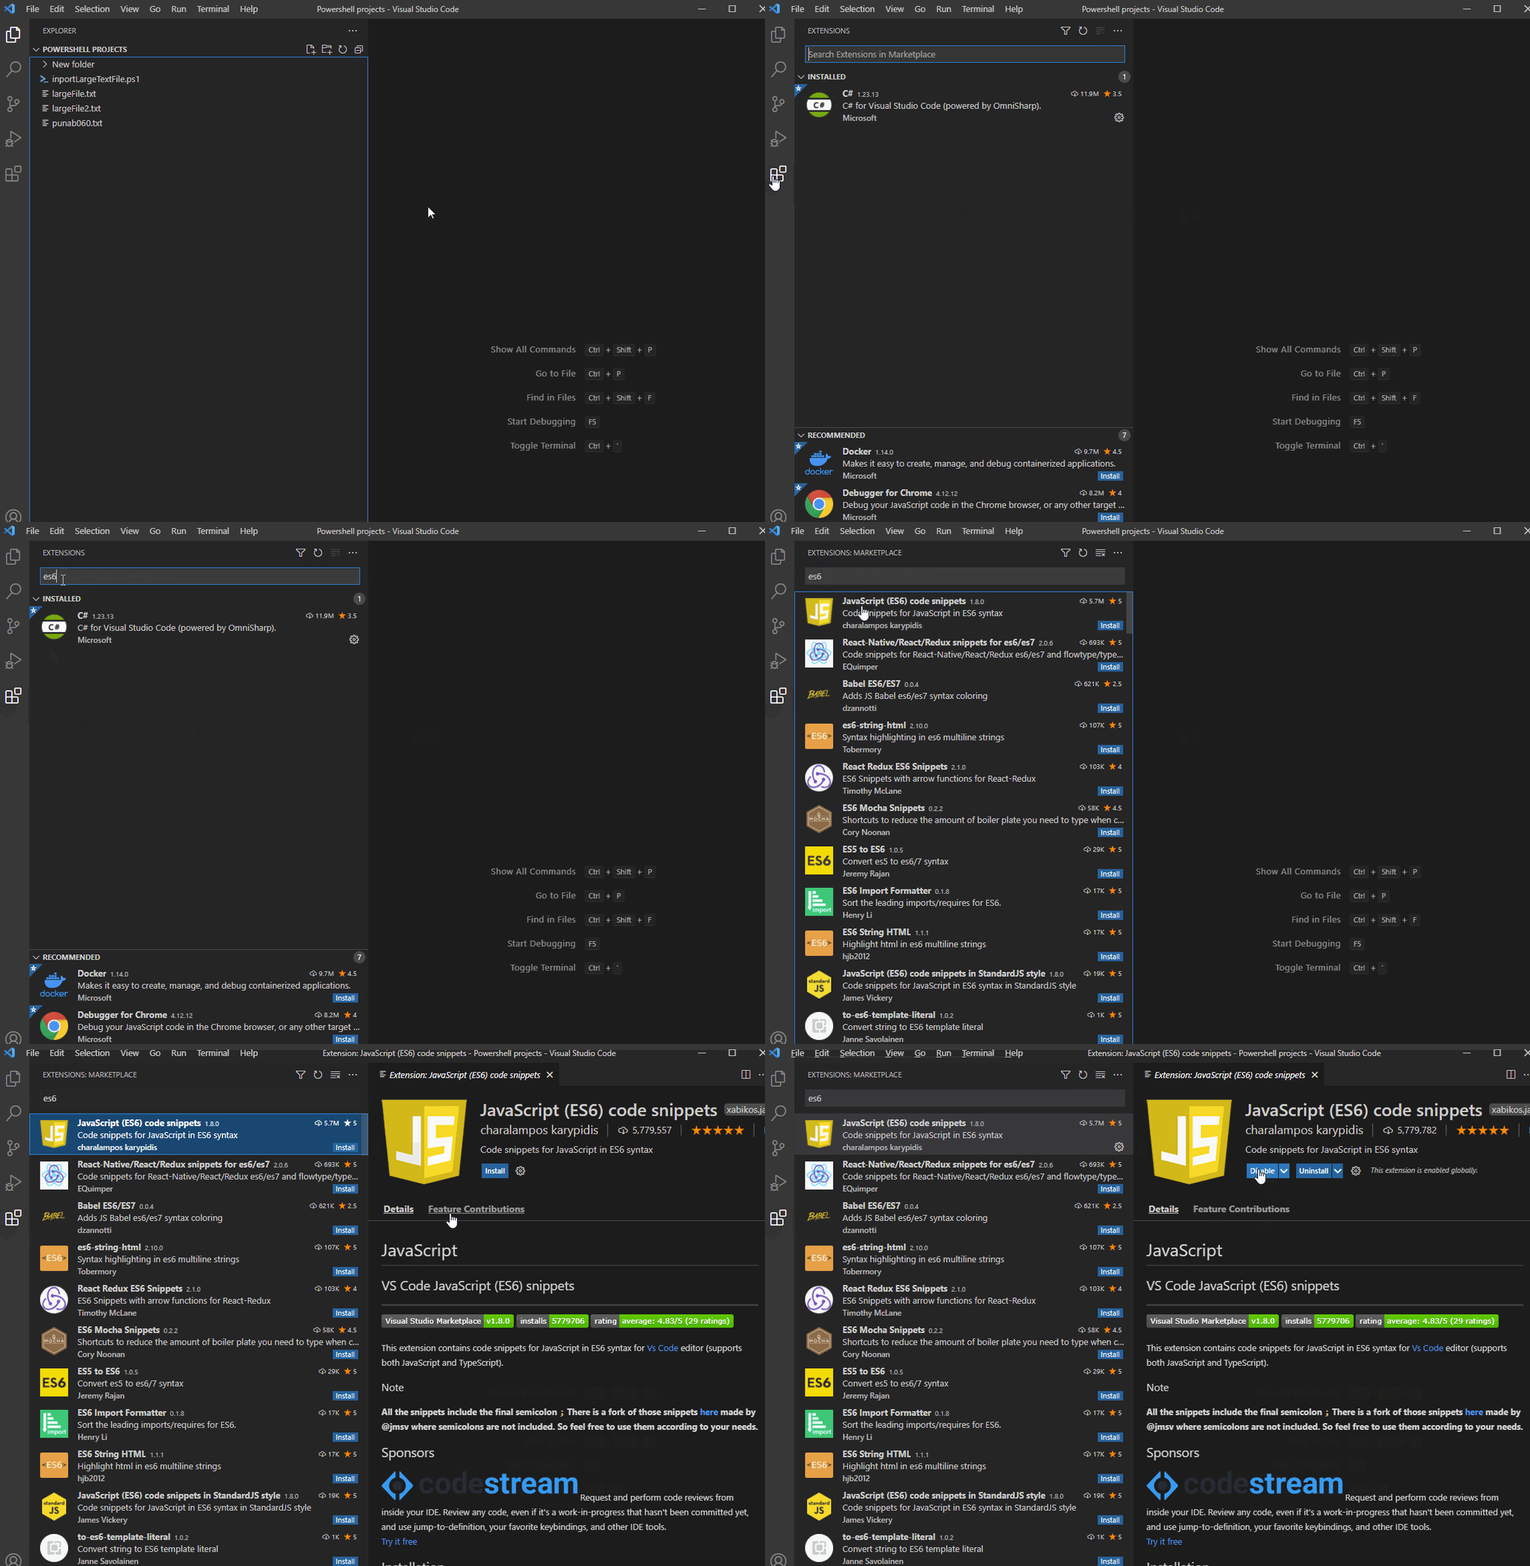
To browse, install and uninstall existing extensions click on the extension icon on the left-hand side of the Visual Studio code window.
Alternatively, you can press Shift + Ctrl + X or Shift-Command on Windows and Mac respectively.
Once you have found the extension you are looking for, select the extension and press install.
Save your fingers some toil by installing this extension.
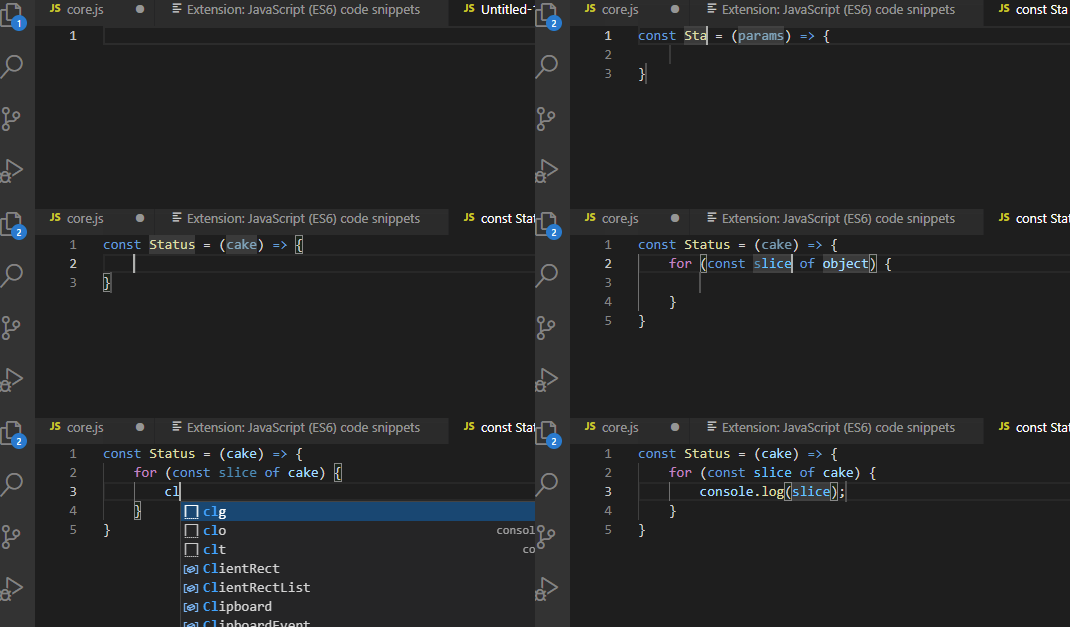
JavaScript (ES6) Code Snippets contains a collection of commonly used code snippets that are linked to a “trigger”. A trigger is typically a memorable 3–4-character abbreviation of what the snippet contains.
For example, the trigger for console.log() Is clg, and the trigger to insert a named function is nfn, combine these two snippets together and we can create this super useful function:
There are snippet extensions available for almost any language or framework you can think of in Visual Studio Code, just search for code snippets in the extension browser.
If you still can’t find what you’re looking for, Visual Studio Code has you covered, why not create your own!
Whilst in Visual Studio Code:
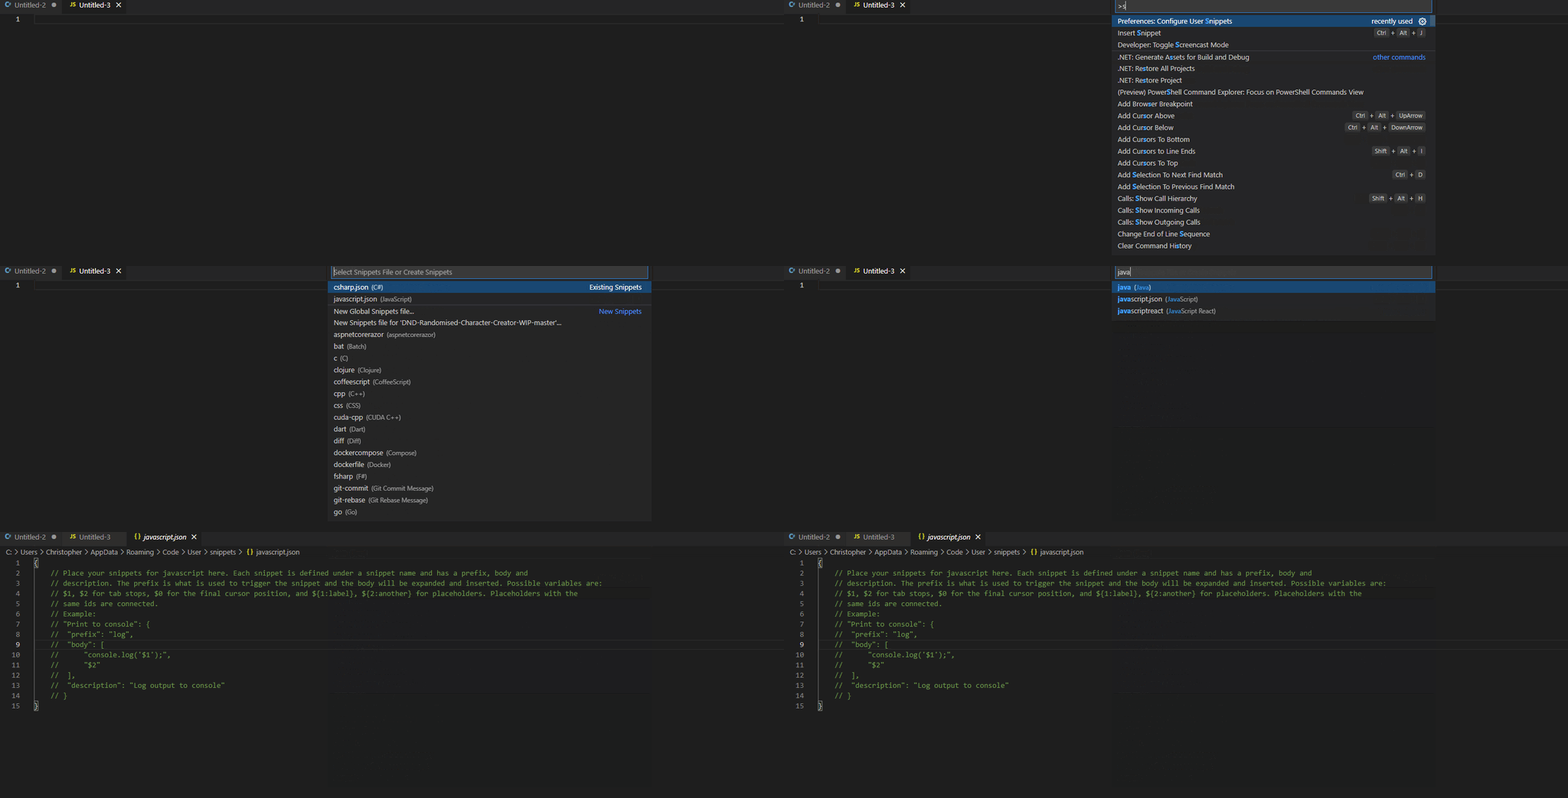
Open the Command Pallet by pressing Ctrl + Shift + P and type snippets
Select Preferences: Open User Snippets
The dropdown will now show you the JSON configuration files for all supported languages, highlight your desired language and press enter.
Each configuration file describes how to format your code snippets for use. Have a go at setting up your own and see your productivity skyrocket.
Top Tip: A site like https://snippet-generator.app or the Snippet Creator extension can further streamline this process by automating all the formatting for you!
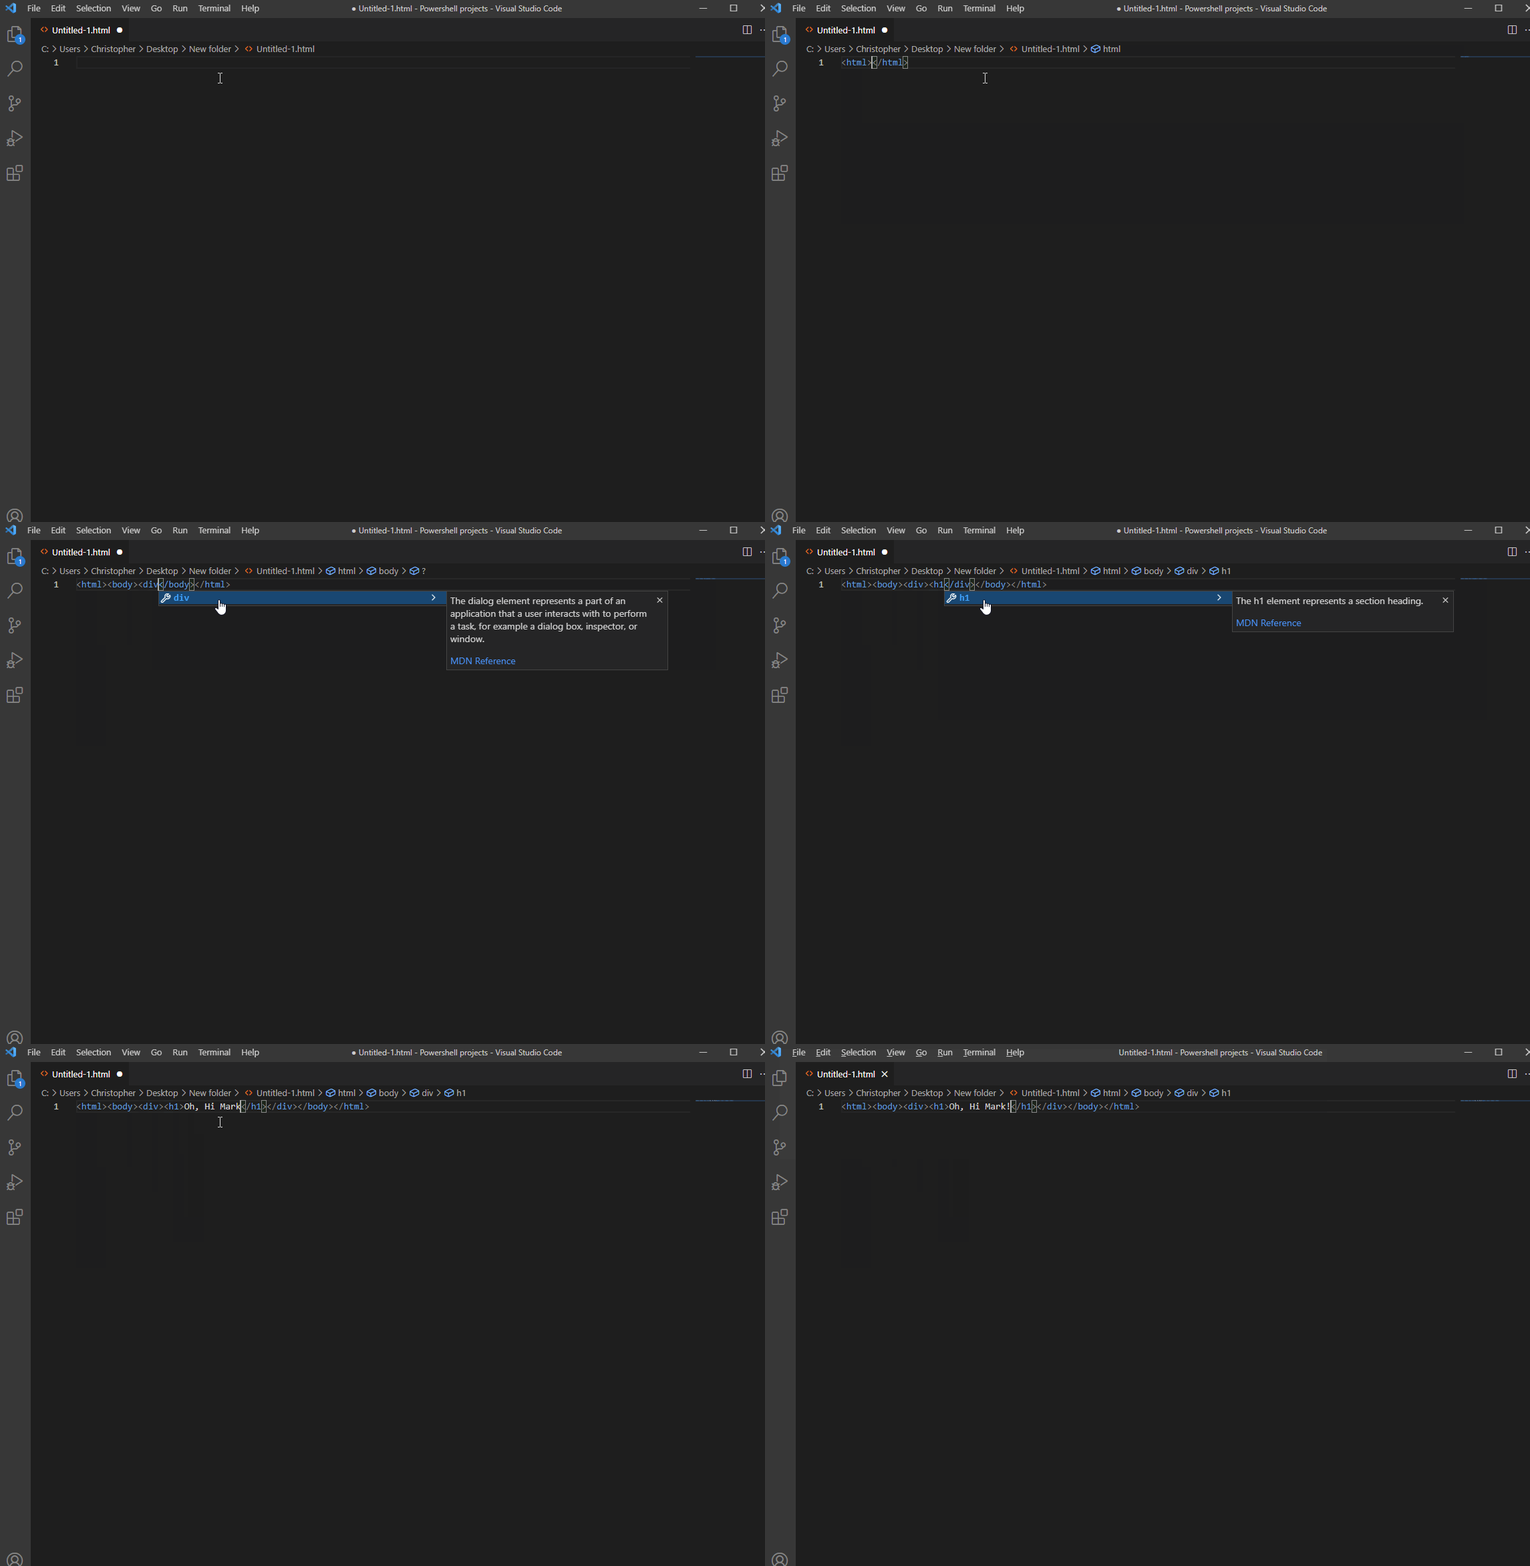
Auto Close Tag is a super simple extension but it’s a massive time-saver, so it belongs on this list. No longer do you need to worry about adding the closing tag for HTML or XML, this extension has got you covered.
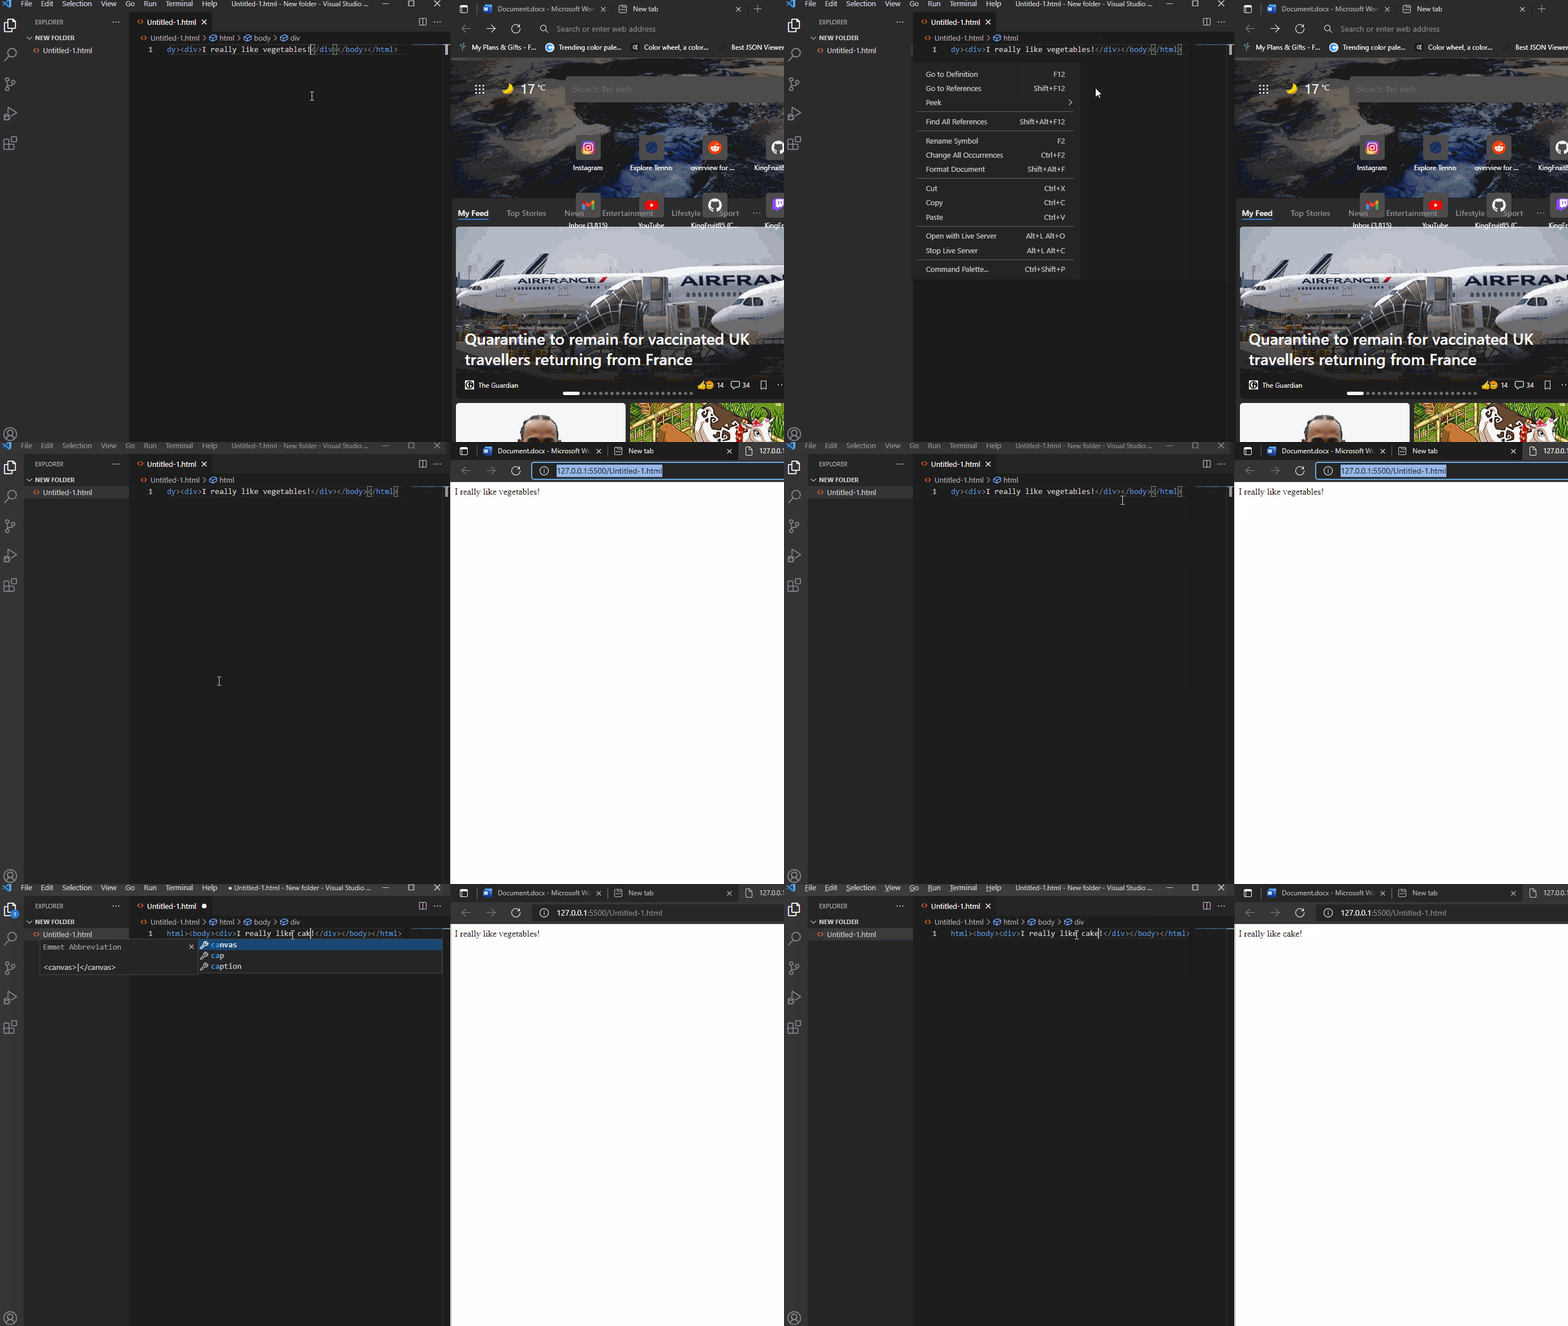
Live server allows you to launch a development local server with a click of a button. Thanks to the extension’s automatic reload feature getting feedback on your changes happens instantly after saving your changes.
To start the server and open the browser window, either press the “Go Live” button at the bottom right of the window, or right-click in the file you want to preview and select “Open with Live Server” from the dropdown menu.
ESLint is the most popular linting extension for Visual Studio Code.
A Linter is a tool that examines your source code for common mistakes, suggests good code standard adherence, and sniffs out code smells before they become a problem. They are a great addition to any developer’s tool kit as they can help detect errors in code before it reaches production. They also contribute to more consistent and maintainable code.
Some linters can be quite opinionated and non-configurable on the style they want you to write code in, however, ESLint gives you the choice to add or remove linting rules and as well as customizing the severity of default rules.
If you’re thinking of customizing ESLint, have a read of the documentation found at ESLint – Pluggable JavaScript linter for some good advice and examples.
If you’re struggling to implement a tricky piece of code or sitting with your head in your hands because the compiler is throwing up a cocktail of error messages you’ve never seen before, and no amount of combing over Stack Overflow is helping, your first step may be to ask a colleague for help. Currently, due to Covid, most Devs are working from home and therefore cannot just get up and pop over the other person’s desk. You may instead be using tools like Microsoft Teams or Zoom to screen share, which are useful but can be limiting.
Liveshare allows a user to share their active coding session with another person using either Visual Studio Code or Visual Studio. This allows both parties to inspect and change the code in real-time as well as sharing the debug environment, with both users able to set breakpoints and step through lines of the program.
Another cool feature is that if your colleague makes a change to your code Liveshare allows you to stage those changes inside your current coding window, this is handy for the above example or perhaps where you are pair programming or conducting code reviews.
But wait, there’s more! Liveshare also includes integrated audio and text chat so there’s no need to also jump on a Teams/Zoom call. This extension allows you to do all of this without ever leaving the Visual Studio environment, which I think is pretty awesome.
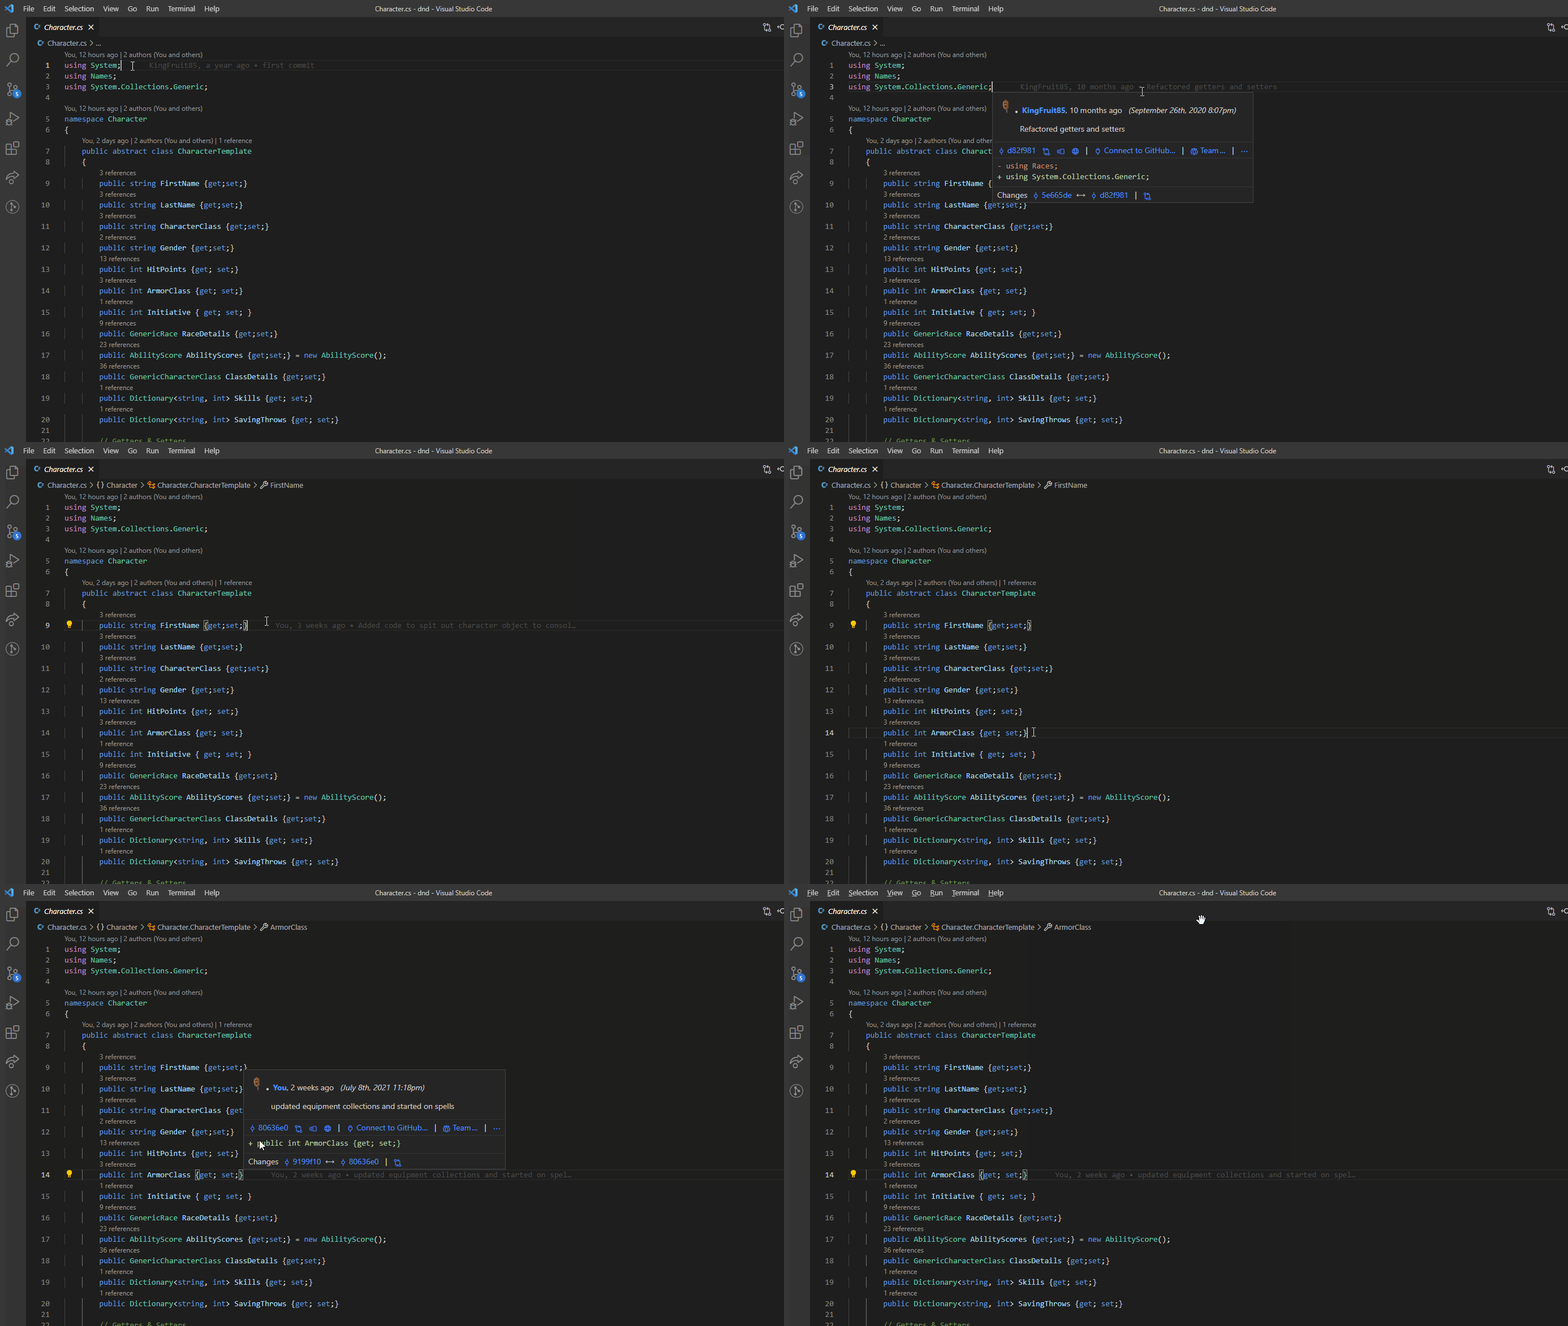
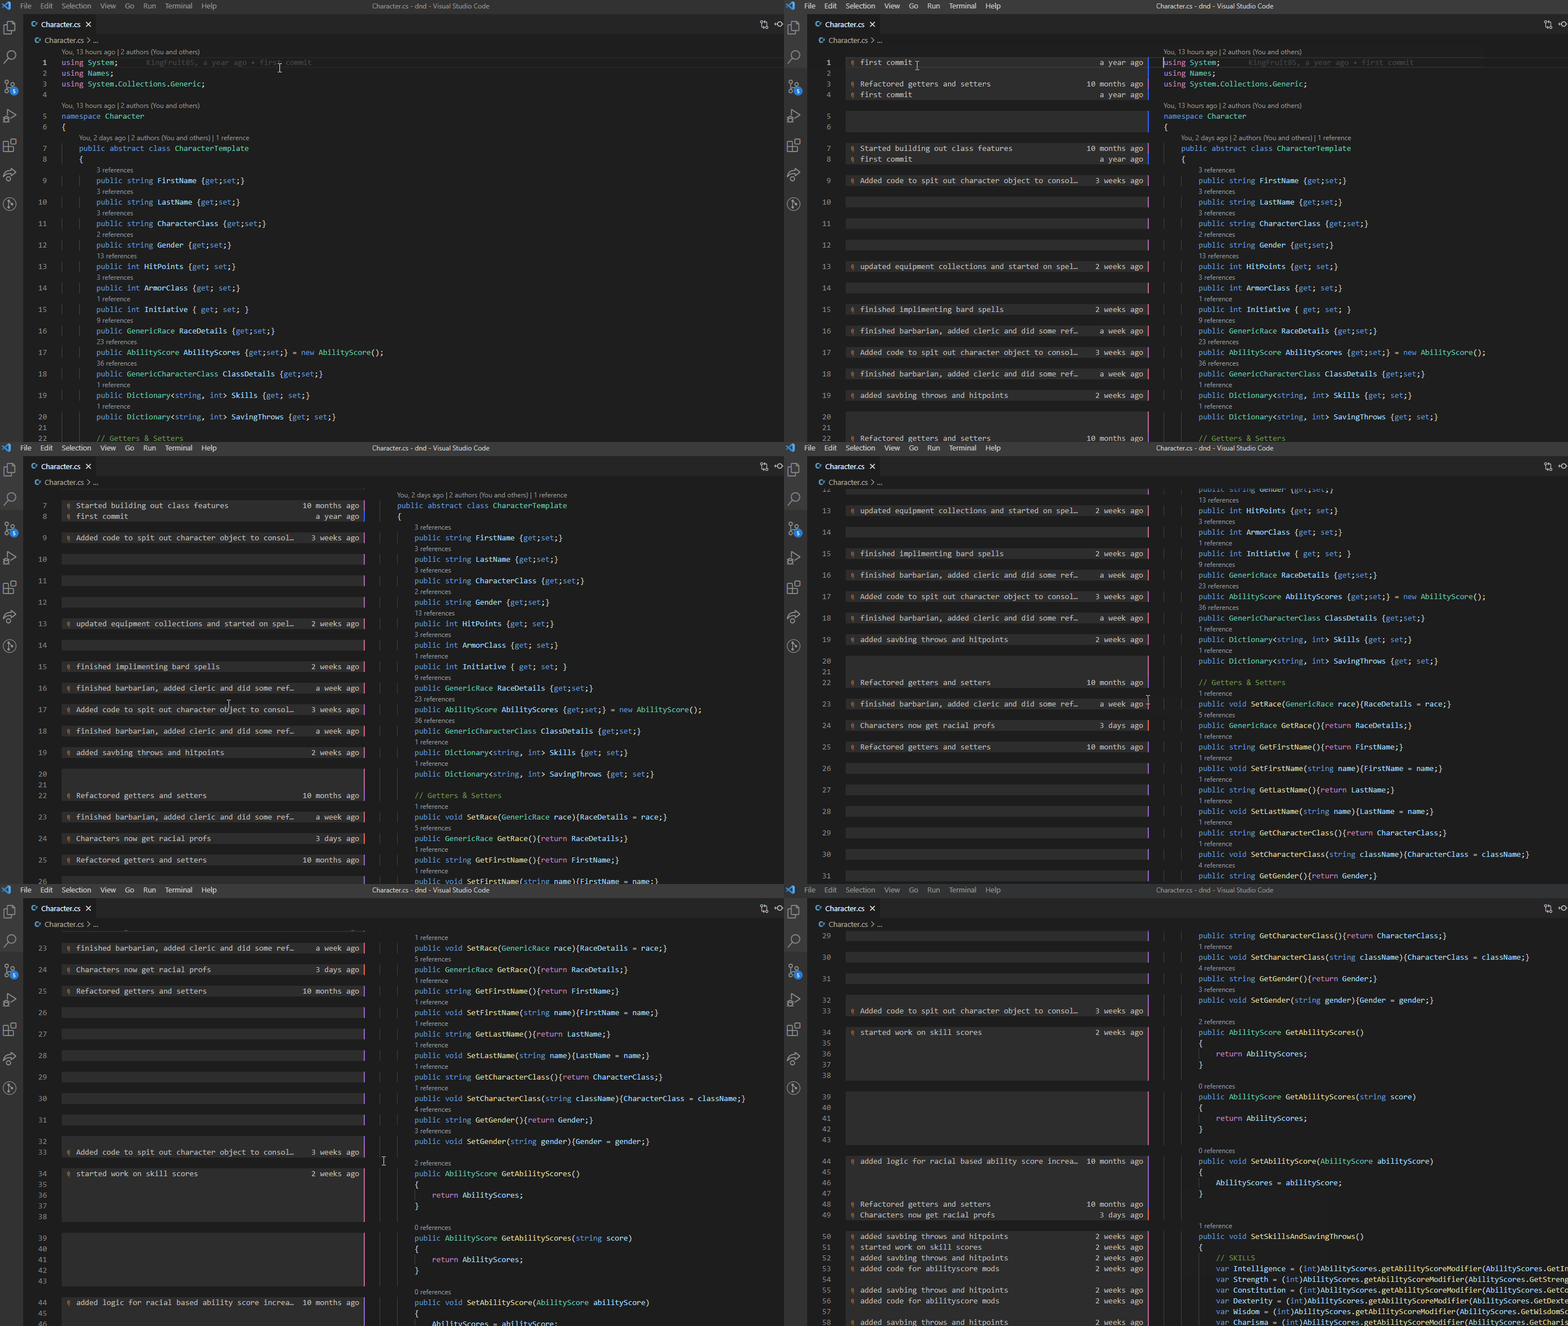
This extension is a must-have if you’re working solo or working as part of a team. GitLens allows users to view who authored the current line they are highlighting in the active code window, view the comments that were included in the commit, and check the file history.
Normally you would have to open GitHub or whichever version control solution your team is using to check the commit history, GitLens allows you to do all of this without having to leave the Visual Studio Code environment.
GitLens has several useful features and configuration that could take up an entire blog post, but I hope you can already see how this is a must-have extension.
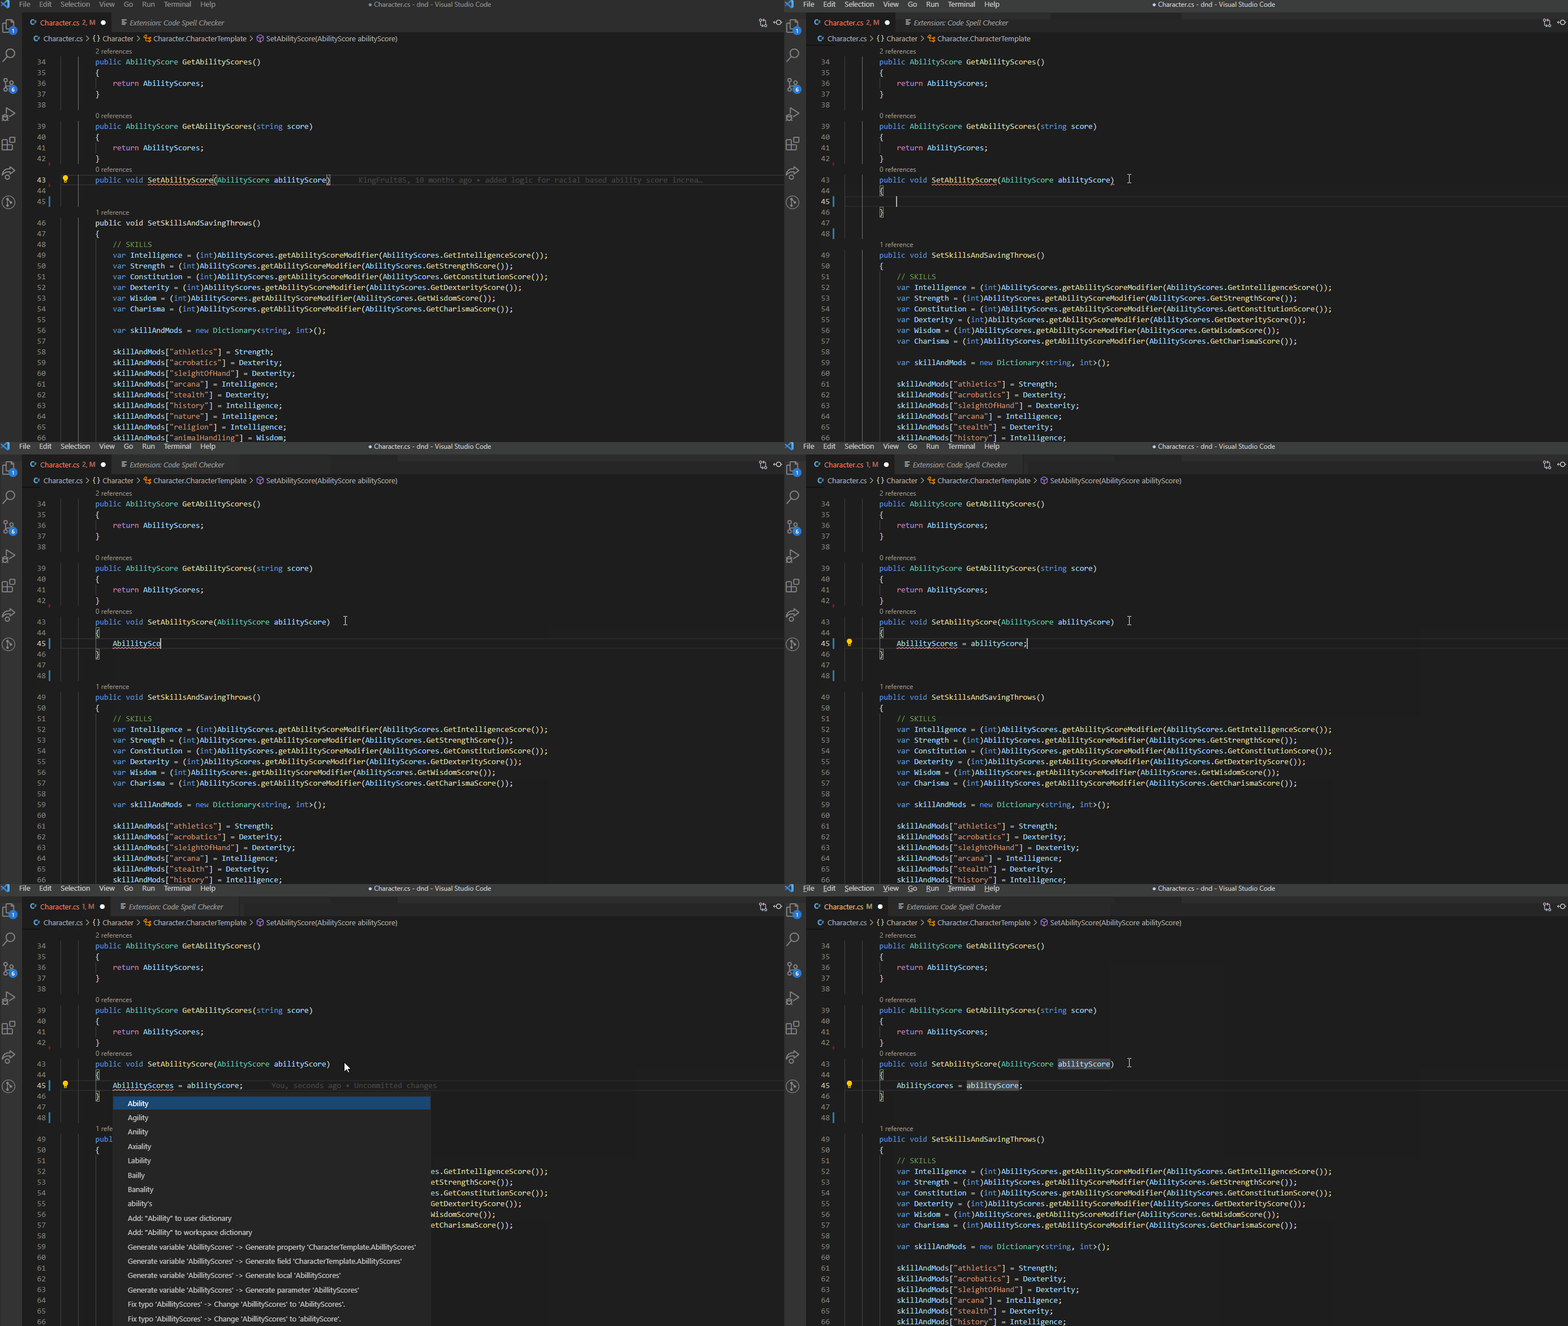
Another simple extension but a huge time-saver, especially if like me your spelling isn’t anything to write home about.
What this extension does is in the name; it checks your spelling and offers suggested corrections. If Code Spell Checker detects a single word or part of a word in a variable has been spelt incorrectly, it will highlight the word with a red squiggly line, to view spelling suggestions, place your cursor over the work and press alt +.
If you freelance by the hour or are a data nerd like me, I think you’ll like this extension.
Code Time supplies statistics about your coding session activity, breaking down time spent at the computer, time spent actively coding, coding time inside and outside of work hours as well as stats like lines added/removed. The free version of Code Time stores a rolling 90 days’ worth of data, this can be increased to unlimited by subscribing to their monthly payment plan ($9.95 per month at the time of writing this).
This is the only extension on the list where you’ll need to make an account; this can be done via Google accounts or GitHub accounts authentication and allows you to view more detailed statistics and data visualizations at app.software.com.
It also has Integrations with other services like Spotify to track what music you work best with and Google Callendar/Microsoft Outlook to show how much code time availability you’ll have any given day.
Another handy feature of this extension is Flow Mode. Placing yourself in Flow Mode blocks notifications from Slack by placing you in Do Not Disturb mode and setting a custom status message warning people you may not reply at once. Pair this with Visual Studio Code’s Zen Mode CTRL + K + Z and you can focus on the task at hand.
If you’re a front-end developer you’re going to be all too familiar with the Chrome Debugger, it’s a great tool but wouldn’t it be nice if you didn’t have to leave the Visual Studio Code environment to access it, fortunately, that’s what the Debugger for Chrome extension does.
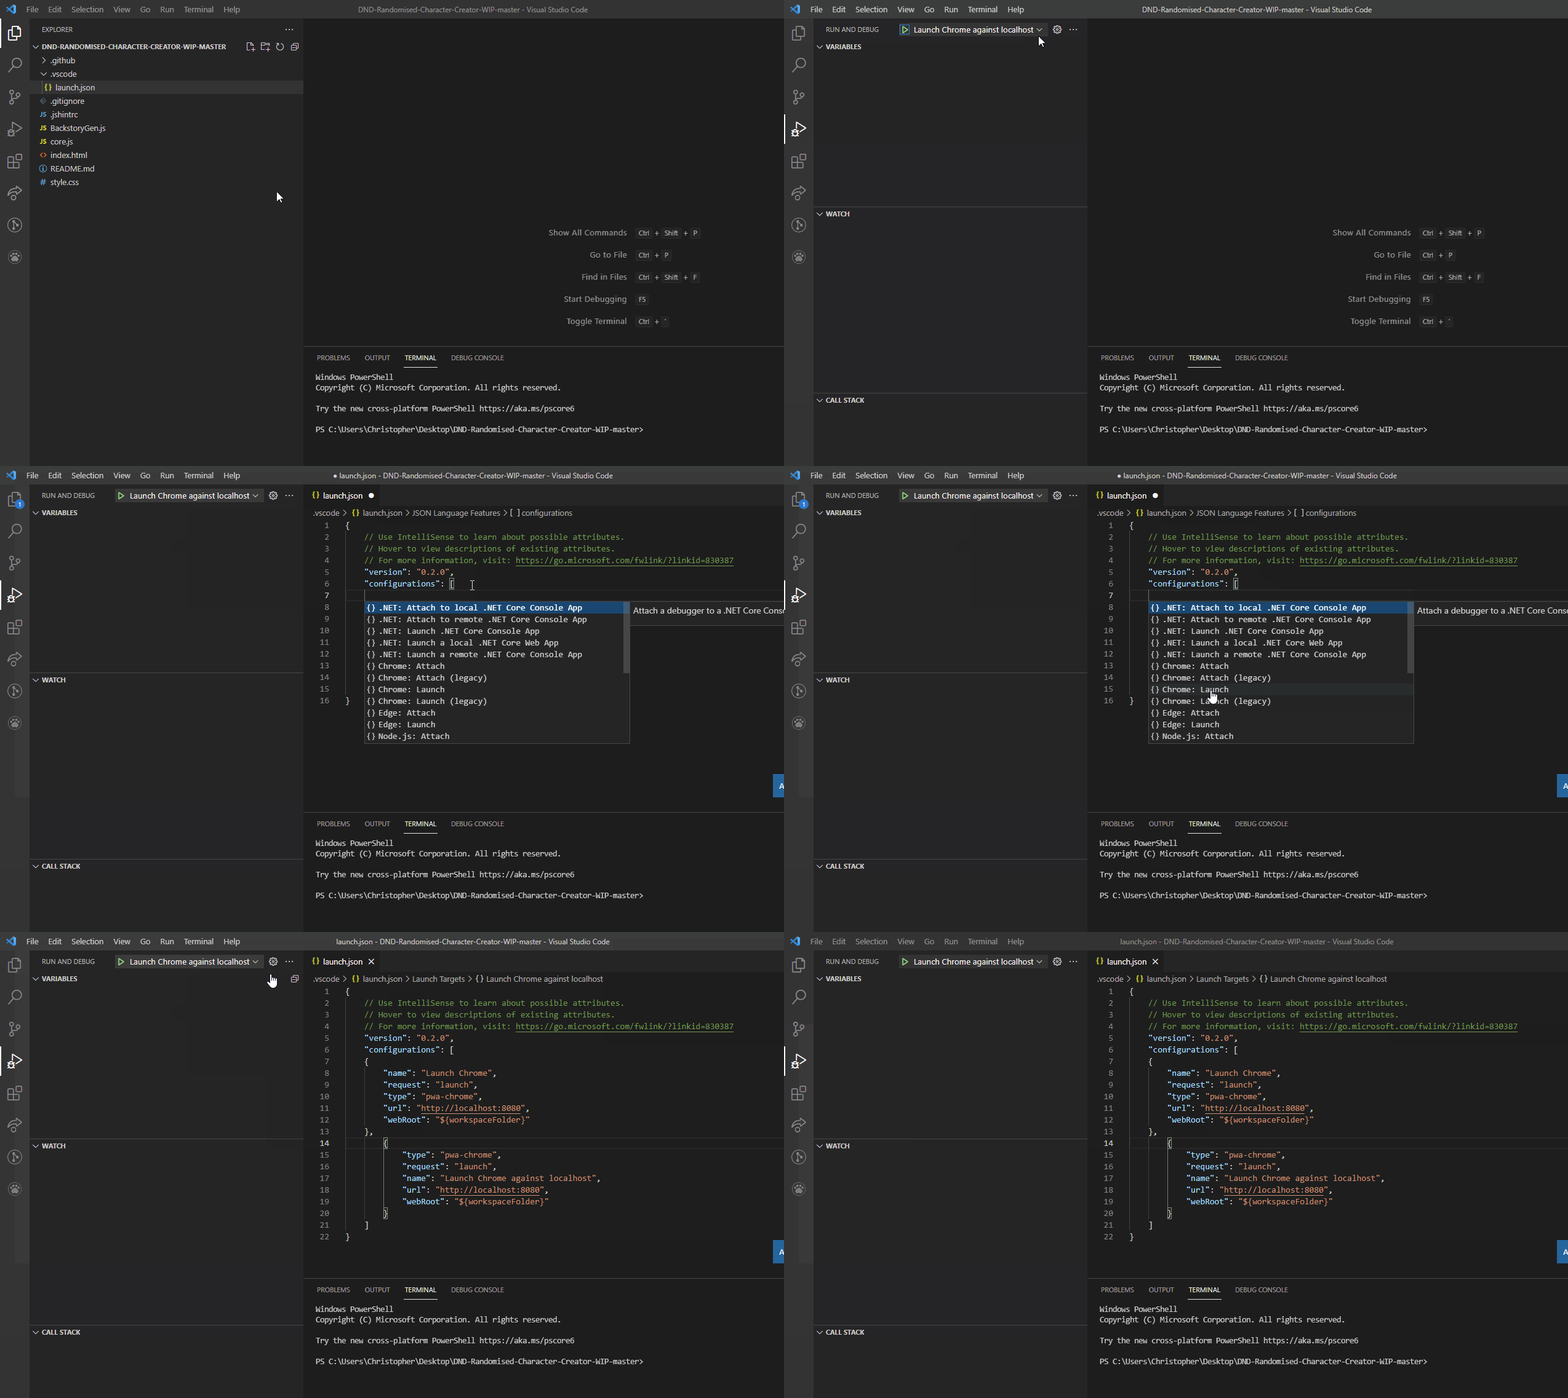
This extension requires a small bit of setup, but it’s worth it. The first thing you’ll want to do after installing the extension is to create a launch file for the Visual Studio Code Debugger, this will hold the different configurations for your project’s debugger. To do this click the debug section in the Activity Bar and select “Add Configuration” from the drop-down bar. This will op the launch.json file in which you can add the “Launch Chrome” config, see below:
Next step is to launch your development server and begin the debug session in Visual Studio Code by clocking the green arrow next to your new configuration in the debug tab.
And now you’re good to go, enjoy being able to set breakpoints, view locales, and edit your code all inside of Visual Studio Code!
And now to end the list with a nice simple extension that will enable you to add extra clarity to your code comments.
Better Comments enables you to break away from the big green blob of comments you usually read or write and instead write more human-readable comments.
It does that by adding colour-coded comment categories such as Alerts, Queries, and TODO’s, all of which can be customised as well as adding your own comment categories which can be defined in the extension settings.
4min read On 13th August 2026, a storm knocked out cooling at RadiusDC’s Phoenix data centre, which hosted essential Namecheap operations. To protect hardware from thermal damage, Namecheap took services offline while temporary chillers were brought in. The incident and recovery ran for roughly 30 hours, with Namecheap’s own site unreachable for about 11 hours 42 minutes
3min read On Wednesday 19 August, Monzo had an outage. DownDetector logged more than 3,000 reports by midday. Monzo’s own statement was direct about what it did next: it activated Monzo Stand-in, its fully independent backup bank, while it investigated an issue affecting customers. By the end of the day, Monzo said the issue was resolved and
3min read GitHub’s incident on 17 August 2026 ran from 13:28 to 21:15 UTC, seven hours and forty-seven minutes. At peak, web and API traffic saw error rates of around 20%, while archive and raw-content downloads reached roughly 50%. SAML and OIDC authentication, SCIM and Team Sync were affected alongside Git operations, Actions, Pages, Issues, Pull Requests
3min read Adding a new website, launching a customer portal, or handing a service to a new team should be straightforward. Setting up monitoring is part of that job, but it is easy for a manual step to be missed when information is spread across several systems. StatusCake now integrates with viaSocket, giving teams a way to connect
7min read A website may be standing and still be in trouble. It may answer a request, return a cheerful 200 OK, and yet load slowly enough that visitors begin to lose patience. Its certificate may be nearing expiry. Its domain records may have changed. A server may be filling its disk in the background, patient and
6min read StatusCake tells you that something might be broken. Hermes can check whether it really looks broken, decide who should hear about it, send the email, and keep the record for tomorrow morning’s summary.
Daniel
May 13, 2026
Sign up for the StatusCake newsletter
Want to know how much website downtime costs, and the impact it can have on your business?
Find out everything you need to know in our new uptime monitoring whitepaper 2021