A website may be standing and still be in trouble. It may answer a request, return a cheerful 200 OK, and yet load slowly enough that visitors begin to lose patience. Its certificate may be nearing expiry. Its domain records may have changed. A server may be filling its disk in the background, patient and unnoticed, while every public page continues to look perfectly well.
These are not always outages in the obvious sense, but they are often the beginnings of one. The past year has made that plain enough. AWS saw a major US-EAST-1 disruption in October 2025, tied to DNS resolution issues for regional DynamoDB endpoints. Cloudflare had a global incident in November 2025 after a database permissions change caused a Bot Management feature file to grow unexpectedly and propagate across its network. Neither story was simply “a website went down.” They were reminders that modern availability depends on layers: DNS, cloud regions, certificates, performance, infrastructure, alerting, and communication.
This is why uptime monitoring, useful though it is, should not be the whole watch.
For a small personal site, knowing whether the homepage is reachable may be enough. For a business, a store, an application, or any website that customers depend on, availability is only one part of the story. The better question is not simply “is the site up?” but “is the site healthy enough for people to use, trust, and return to?”
Here is the monitoring checklist every serious website should have in place.
1. Uptime Monitoring
Uptime monitoring is the outer wall. It tells you whether your website, API, or service can be reached at all.
At a minimum, you should monitor your most important public pages: the homepage, login page, checkout flow, app dashboard, API endpoints, and any page customers rely on to get work done. Depending on the service, this may mean HTTP checks, TCP checks, DNS checks, ping checks, SMTP checks, SSH checks, or push checks for jobs and internal systems that are not publicly reachable.
The important thing is to monitor what matters, not only what is convenient. A homepage can be available while the login page is broken. An API can fail while the marketing site remains untouched. A checkout page can vanish quietly behind a working navigation menu.
A good uptime setup should tell you when the part of the site that matters to the business has actually become unavailable.
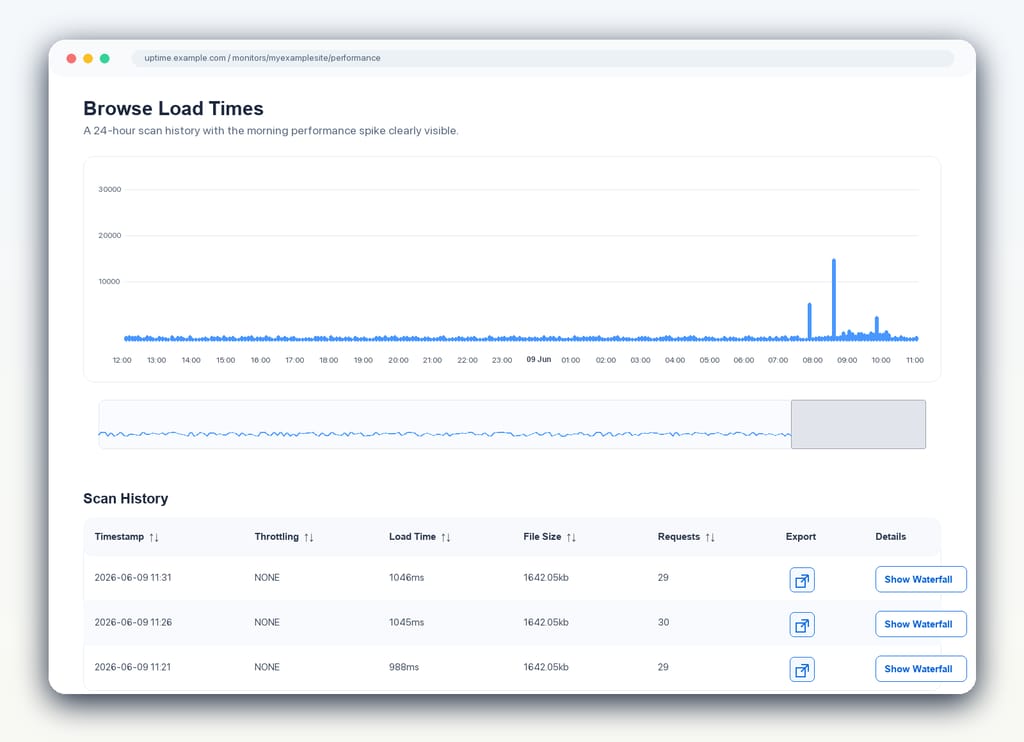
2. Response Time and Regional Availability
A website can be up and still feel broken.
If a page takes too long to respond, most users will not pause to wonder whether the server is technically available. They will leave, refresh, complain, or try again later. Slowness is not always as dramatic as downtime, but it can do much of the same damage.
You should track response time over time, not only in the moment of failure. This helps you see when performance begins to decay, when certain pages become heavier, or when a region starts receiving a worse experience than everyone else.
Regional monitoring is especially important for businesses with customers in more than one place. A site that loads quickly in London may be sluggish in Sydney. A service that is reachable from one monitoring location may be unavailable from another. From the customer’s point of view, the only region that matters is the one they are in.
3. Page Speed Monitoring
Response time tells you how quickly the server begins to answer. Page speed tells you more about what the visitor actually experiences.
This has become more important, not less. Google replaced First Input Delay with Interaction to Next Paint as a Core Web Vital in 2024, which means responsiveness is now judged more broadly across a visitor’s interactions, not only the first one. Large images, slow scripts, third-party tags, render-blocking resources, and heavy interfaces can all turn a technically available site into a poor experience.
Page speed monitoring should cover key pages rather than only the homepage. Product pages, pricing pages, checkout pages, sign-up pages, and logged-in application screens often matter more than the front door. If those pages become slow, the business feels it.
It is also worth setting thresholds. You do not want to learn that a page has been getting slower for weeks only after rankings fall or customers begin to mention it. Monitoring should give you the chance to fix the problem while it is still only a warning.
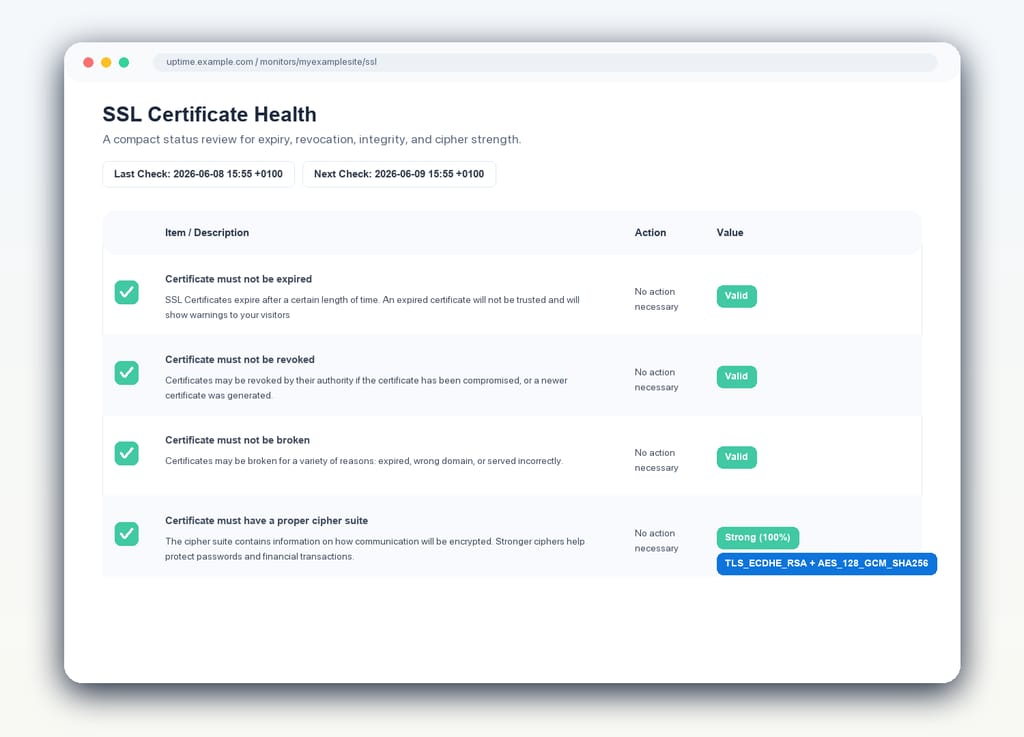
4. SSL Certificate Monitoring
An expired SSL certificate is one of the most avoidable ways to lose trust, and the margin for forgetting is getting smaller.
Under the CA/Browser Forum’s updated baseline requirements, publicly trusted TLS certificates are being shortened in stages: 200 days from March 2026, 100 days from March 2027, and 47 days from March 2029. What used to be an annual housekeeping task is becoming a much tighter operational rhythm. For teams with several domains, subdomains, environments, load balancers, customer portals, and API endpoints, that change turns certificate monitoring from a useful safeguard into a necessity.
When a certificate fails, visitors may see a browser warning before they see your site. For many people, that is the end of the journey. They will not inspect the reason, forgive the oversight, and proceed bravely into the application. They will assume something is wrong and leave.
SSL monitoring should do more than watch the expiry date. A proper setup should check certificate validity, renewal windows, revocation status, protocol issues, cipher strength, and mixed content. The goal is not simply to avoid the dramatic failure of an expired certificate, but to keep the whole chain of trust in good order.
5. Domain Monitoring
Domains are easy to forget because they usually sit quietly in the background. Then, one day, they do not.
A missed renewal can take a business offline as surely as a server outage. DNS changes can send traffic to the wrong place. WHOIS and RDAP records can reveal administrative drift. Blacklist appearances can suggest a reputation or security problem before the business has noticed anything visibly wrong.
Domain monitoring is also changing with the wider domain registration ecosystem. WHOIS has been giving way to RDAP, with the IETF noting that the formal WHOIS obligation for most gTLD registries and registrars ended in January 2025. That may sound like background plumbing, but it matters because domain ownership, registration records, and expiry signals are part of the infrastructure a business depends on.
Domain monitoring should track expiry dates, renewal reminders, DNS changes, registration data changes, and blacklist status. It is not glamorous work, but it protects the address by which customers find you.
Many website incidents begin outside the application itself. The code may be fine. The servers may be fine. The problem may be that the name no longer leads reliably to the place it should.
6. Server Monitoring
Before a website goes down, there are often signs.
CPU usage climbs. Memory pressure grows. Disk space shrinks. Load averages become less forgiving. A server that looked healthy last month begins to run closer to its limits, not yet failing, but no longer comfortable.
Server monitoring gives you a chance to notice these patterns before customers do. Tracking CPU, memory, disk usage, and other core resource thresholds helps you catch the slow approach of an outage rather than only the final event.
This is especially useful when alerts can be tuned with care. Not every brief spike deserves a midnight alarm. But repeated pressure, sustained resource usage, or a disk steadily moving toward full capacity should be seen and acted on before it becomes a crisis.
7. Alert Quality and Escalation
A monitoring system is only as useful as the alerts it sends.
If alerts are too noisy, people begin to distrust them. If they are too vague, the person receiving them still has to begin the investigation from scratch. If they go to the wrong place, the right person may not learn about the problem until much later.
Good alerting should be timely, accurate, and routed through channels your team actually uses. Email may be enough for some teams. Others need Slack, Microsoft Teams, webhooks, SMS, phone calls, or an incident management tool. The best choice is the one that reaches the responsible person quickly without waking everyone for every small disturbance.
False positives deserve special attention. A monitoring system that cries out too often eventually trains people to listen less carefully. Verification, sensible thresholds, and clear escalation rules help preserve trust in the alarm itself.
8. Dashboards, Reports, and Status Pages
Monitoring is not only for the person on call.
Support teams need to know when customers may be affected. Managers need to understand reliability over time. Clients may need reports. Customers may need a public status page that tells them what is happening without opening a support ticket.
The large infrastructure incidents of 2025 showed this clearly. During a cloud or network provider outage, the question for many teams is not only “are we down?” It is “which customers are affected, which regions are affected, what do we know, and what can we say with confidence?” A private dashboard and a public status page serve different purposes. One helps the team investigate. The other helps customers understand.
Dashboards and reports turn scattered checks into a shared picture. They help teams see patterns, review incidents, and understand whether reliability is improving or slipping. Public status pages give customers a place to look when something is wrong, and they show that the team is aware, present, and working.
A Better Way to Watch
The old question was simple: is the website up?
It is still a good question, but it is no longer enough on its own. A useful monitoring setup should watch availability, speed, certificates, domains, servers, alerts, and communication. It should help you notice the small failures before they become large ones, and it should give the right people enough information to act.
Most incidents do not begin as grand disasters. They begin as a certificate nearing expiry, a page growing slower, a server filling its disk, a DNS record changing, a cloud dependency misbehaving, or an alert sent somewhere nobody is looking.
The purpose of monitoring is not to stare anxiously at every moving part. It is to keep a steady watch over the things your customers depend on, so that when something begins to drift, you know early enough to bring it back.
With StatusCake, you can monitor uptime, page speed, SSL certificates, domains, servers, alerts, dashboards, reports, and status pages in one place, giving your team a clearer view of website health before your customers are the first to notice something is wrong.
7min read A website may be standing and still be in trouble. It may answer a request, return a cheerful 200 OK, and yet load slowly enough that visitors begin to lose patience. Its certificate may be nearing expiry. Its domain records may have changed. A server may be filling its disk in the background, patient and
6min read StatusCake tells you that something might be broken. Hermes can check whether it really looks broken, decide who should hear about it, send the email, and keep the record for tomorrow morning’s summary.
3min read The allure of OpenClaw is undeniable. You deploy a highly autonomous, self-hosted AI agent, give it access to your repositories and inboxes, and watch it reason through complex workflows while you sleep. It is the dream of the ultimate 10x developer tool realized. But as any veteran DevOps engineer will tell you: running an LLM-backed
7min read There are cloud outages, and then there are us-east-1 outages. That distinction matters because failures in AWS’s Northern Virginia region rarely feel like ordinary regional incidents. They tend instead to expose something larger and more uncomfortable: too much of the modern internet still behaves as though one place is an acceptable concentration point for infrastructure,
7min read Artificial intelligence is making software easier to produce. That much is already obvious. Code that once took hours to scaffold can now be drafted in minutes. Boilerplate, integration logic, tests, refactors and small internal tools can be generated with startling speed. In some cases, even substantial pieces of implementation can be assembled quickly enough to
10min read Whilst AI has compressed the visible stages of software delivery; requirements, validation, review and release discipline have not disappeared. They have been pushed into automation, runtime and governance. The real risk is not that the lifecycle is dead, but that organisations start acting as if accountability died with it. There is a now-familiar story about
James Barnes
April 2, 2026
Sign up for the StatusCake newsletter
Want to know how much website downtime costs, and the impact it can have on your business?
Find out everything you need to know in our new uptime monitoring whitepaper 2021