

StatusCake

Feature Spotlight: Dashboards

Dashboards are pages which can show all your StatusCake operations in one place, from your uptime tests to your virus scans, making them a great tool for internal teams to get an instant view of service status as a whole. Once generated the page will be fully optimized to fit nicely on large office monitors.

dashboard1

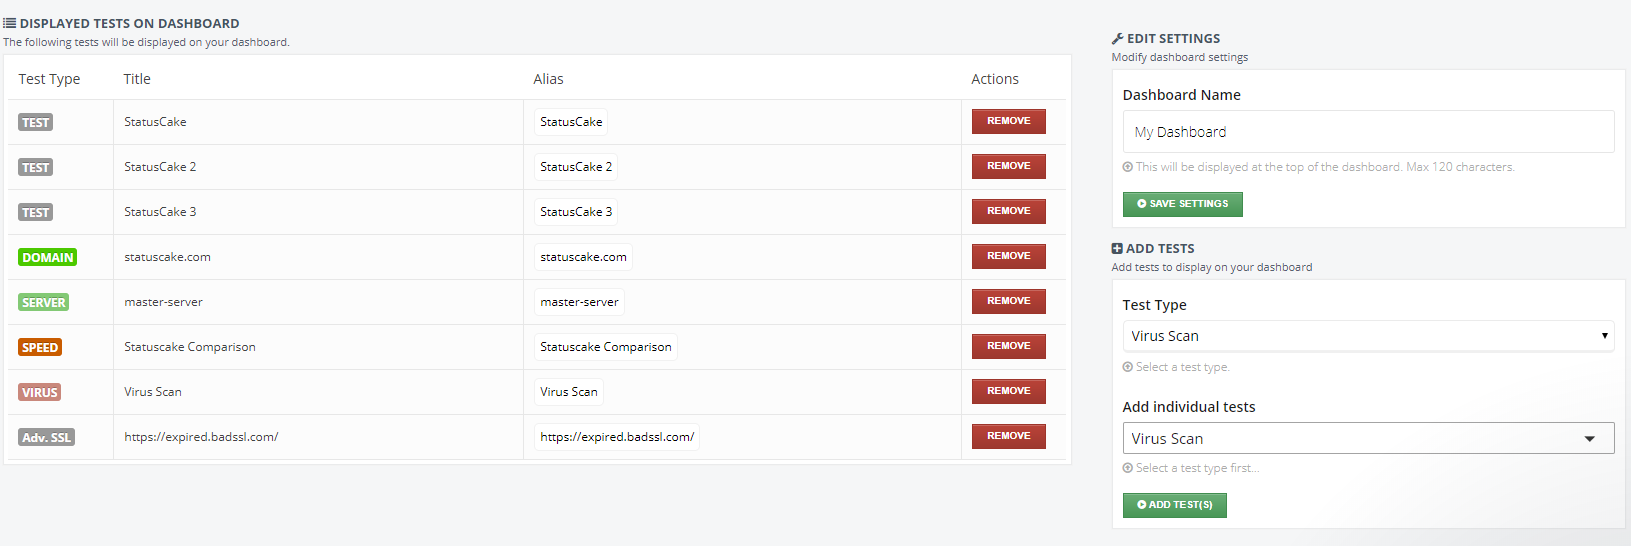
Dashboards are simple to configure. if you haven’t tried this out before then you can get stuck in by clicking here. Simply give the dashboard a name, then select which tests should be added. You can add all of our test types to these pages including Uptime, SSL, Domain, Page Speed, Server Monitor, and Virus Scan types.

Once you have added your tests to the dashboard you are ready to go and can publish the new page by saving it, at this point a hashed link will be generated to ensure that only people you share this with will be able to gain access.

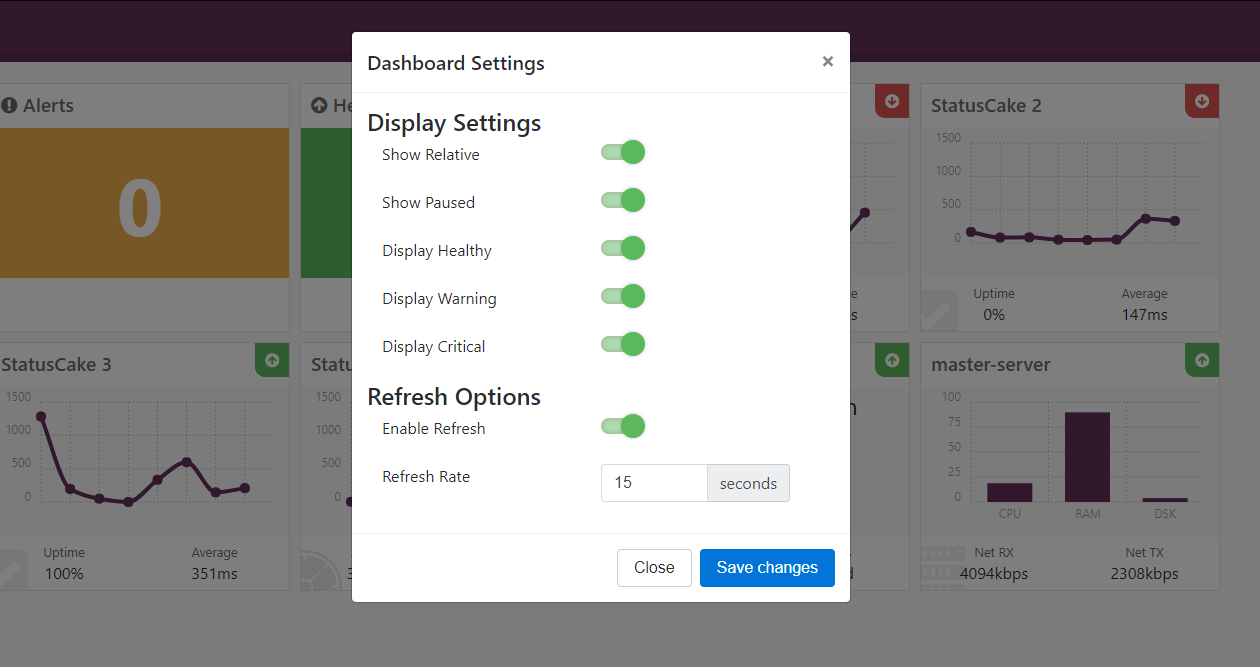
When published, the dashboard can have additional options configured at any time through the settings icon at the top right corner. The options here enable you to filter the data that appears, for example, you can select to only see the services which are having a problem. You can also set a custom refresh rate for the page.

dashboards3

If you’d like to read and know more about this feature, or wanted to see the full set up process please give our support team a shout, or alternatively, check out the relevant article on our Knowledgebase.

Share this

More from StatusCake

What Broke GitHub on August 17 and How Retries Made the Incident Worse

3 min read GitHub’s incident on 17 August 2026 ran from 13:28 to 21:15 UTC, seven hours and forty-seven minutes. At peak, web and API traffic saw error rates of around 20%, while archive and raw-content downloads reached roughly 50%. SAML and OIDC authentication, SCIM and Team Sync were affected alongside Git operations, Actions, Pages, Issues, Pull Requests

Automate StatusCake Monitoring with viaSocket

3 min read Adding a new website, launching a customer portal, or handing a service to a new team should be straightforward. Setting up monitoring is part of that job, but it is easy for a manual step to be missed when information is spread across several systems. StatusCake now integrates with viaSocket, giving teams a way to connect

Website Monitoring Checklist: What to Track Beyond Uptime

7 min read A website may be standing and still be in trouble. It may answer a request, return a cheerful 200 OK, and yet load slowly enough that visitors begin to lose patience. Its certificate may be nearing expiry. Its domain records may have changed. A server may be filling its disk in the background, patient and

Blog

Beyond Uptime: Building a Self-Healing OpenClaw Observability Stack

3 min read The allure of OpenClaw is undeniable. You deploy a highly autonomous, self-hosted AI agent, give it access to your repositories and inboxes, and watch it reason through complex workflows while you sleep. It is the dream of the ultimate 10x developer tool realized. But as any veteran DevOps engineer will tell you: running an LLM-backed

When AWS us-east-1 Fails, Much of the Internet Fails With It

7 min read There are cloud outages, and then there are us-east-1 outages. That distinction matters because failures in AWS’s Northern Virginia region rarely feel like ordinary regional incidents. They tend instead to expose something larger and more uncomfortable: too much of the modern internet still behaves as though one place is an acceptable concentration point for infrastructure,

Want to know how much website downtime costs, and the impact it can have on your business?

Find out everything you need to know in our new uptime monitoring whitepaper 2021

*By providing your email address, you agree to our privacy policy and to receive marketing communications from StatusCake.