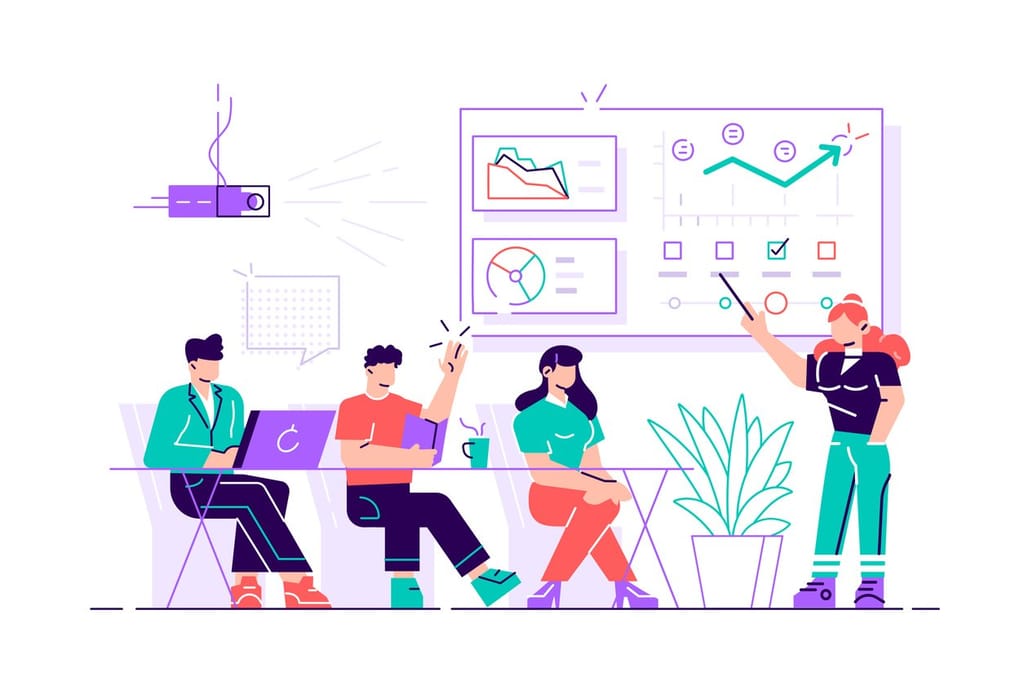
The aim of your website is obviously to get potential customers to engage with it as much as possible, and ultimately, make a purchase. But as we well know, it isn’t as simple as someone landing on your website and instantly converting. 9 times out of 10, there’s a whole sequence of actions that take place before a customer makes a purchase. The best thing? You can see exactly what this sequence of events looks like by analysing and combining data from a couple of your tools so you can make better, more informed decisions about the content on your website.
Using Hotjar for website interacts
For example, if you’ve got Hotjar in place on your website, you should be able to see customers’ behaviour on your site. You’ll see how far down a page they got, if they clicked on a button, for example, if they added an item to their basket, and so on. Compare this to the data you see in Google Analytics for bounce rate, for conversions from a button, and you can start to see the sequence.
Real-life example
Here at StatusCake, we want to know how many people click on the “Monitor now for free” and “Book a demo” buttons. But not only that, we want to know how many of those then went on to complete the action. By using both data from Hotjar and from Google Analytics, you can see how many visitors did this, and how they came to convert.
Once you start to report on these data points together, a picture starts to emerge of how customers interact with your website. Here’s a couple of examples to look out for when thinking about how to increase engagement on your website, or how to increase conversions.
1. Do customers engage better with different colours?
Whether it’s your design team, marketing team, or IT team in charge of your website, there should always be a discussion around whether colour schemes make a difference to a purchasing decision.
In psychology, we know that different colours tend to invoke different emotions in us. For example, red is associated with anger, yellow with happiness. So do colours have a direct impact on your conversions?
Real-life example
Our page speed monitoring page uses yellow in the header banner because through A/B testing, we found that using yellow vs using blue had a direct impact on our customers engaging with the buttons that sat on this banner.
Could this be due to the colours of the buttons you ask? Good question. We tested these too. You will notice on our website that when we have a brighter coloured background like this one, we use darker colours on our buttons to make them more easily accessible.
2. Does chunky content stop customers from engaging with your website?
Chunky content might be good for SEO, with a high word count and keywords, but it isn’t necessarily giving your website visitors the best experience. For example, if you landed on a website and all you could see was a wall of text, would you stay to read it all, or would you click straight off?
We decided to A/B test this on our site to see if a page with a lot of heavy text to very little white space ratio would lead to more conversions compared to a page with less text and more white space.
What do you think the outcome was?
Unsurprisingly, the winner was the page that had less text.
It’s important to remember, however, that less text doesn’t mean less quality. It means that you have to give the same amount of information and detail but in a more succinct, and efficient way. There really is no need for lengthy sentences for the sake of lengthy sentences when shorter ones can tell the same story.
Real-life example
This is a screenshot of a short snippet of content from our server monitoring page. What does this sentence need more than what it already has? The answer is nothing. It summarises a point of our server monitoring in a quick, easy-to-digest sentence that doesn’t require much time or effort from the reader.
But does this convert customers, or make them engage more with the web page?
Our A/B test showed that we had greater interactions from website visitors with paragraphs that were this length, and surrounded by lots of white space.
3. Do images help your customers engage with your website?
This is an interesting question because it can really vary depending on what your website is all about. For example, a B2B website differs hugely from a B2C website, and therefore, so will the images.
At StatusCake, before we launched our new website back in October 2020, we had a high density of product screenshots across our website. They were all very technical, all very developer-heavy, and required a bit more than the average “know-how” to make sense of them. When we launched our new website, we opted for imagery that was more focused on the brand than the product. Mainly because we’ve found that a brand is what first gets a customer interested in a company. That’s not to say that we got rid of screenshots altogether; you can still find these on all of our key feature pages, and our homepage. But the website itself is 90% brand imagery, showcasing our values, and our identity.
Real-life example
We’ve had more comments on our images that are more metaphorical like the above (a team holding up the cake together), than any of our screenshots combined.
These are just 3 examples of the questions you should be asking yourself about your website, and how customers interact with it. Check back later in the month for the next instalment in the series to see what other improvements you could be making to increase in engagement, and conversions.
7min read A website may be standing and still be in trouble. It may answer a request, return a cheerful 200 OK, and yet load slowly enough that visitors begin to lose patience. Its certificate may be nearing expiry. Its domain records may have changed. A server may be filling its disk in the background, patient and
6min read StatusCake tells you that something might be broken. Hermes can check whether it really looks broken, decide who should hear about it, send the email, and keep the record for tomorrow morning’s summary.
3min read The allure of OpenClaw is undeniable. You deploy a highly autonomous, self-hosted AI agent, give it access to your repositories and inboxes, and watch it reason through complex workflows while you sleep. It is the dream of the ultimate 10x developer tool realized. But as any veteran DevOps engineer will tell you: running an LLM-backed
7min read There are cloud outages, and then there are us-east-1 outages. That distinction matters because failures in AWS’s Northern Virginia region rarely feel like ordinary regional incidents. They tend instead to expose something larger and more uncomfortable: too much of the modern internet still behaves as though one place is an acceptable concentration point for infrastructure,
7min read Artificial intelligence is making software easier to produce. That much is already obvious. Code that once took hours to scaffold can now be drafted in minutes. Boilerplate, integration logic, tests, refactors and small internal tools can be generated with startling speed. In some cases, even substantial pieces of implementation can be assembled quickly enough to
10min read Whilst AI has compressed the visible stages of software delivery; requirements, validation, review and release discipline have not disappeared. They have been pushed into automation, runtime and governance. The real risk is not that the lifecycle is dead, but that organisations start acting as if accountability died with it. There is a now-familiar story about
James Barnes
April 2, 2026
Sign up for the StatusCake newsletter
Want to know how much website downtime costs, and the impact it can have on your business?
Find out everything you need to know in our new uptime monitoring whitepaper 2021