


Want to know how much website downtime costs, and the impact it can have on your business?
Find out everything you need to know in our new uptime monitoring whitepaper 2021

At StatusCake a large part of what we do is reacting to current downtime with alerts and logging historical downtime within reports. Today we’d like to take a look at how users can get the most out of customizing these factors.
On our Business level plan all alerts and reports via email can be fully customized to better represent your brand and ensure that the right information needed for your team to address issues quickly and efficiently is always present.
In the image below you can get an idea of the extent to which this is possible, all of our emails the get sent out can be modified as you see fit:
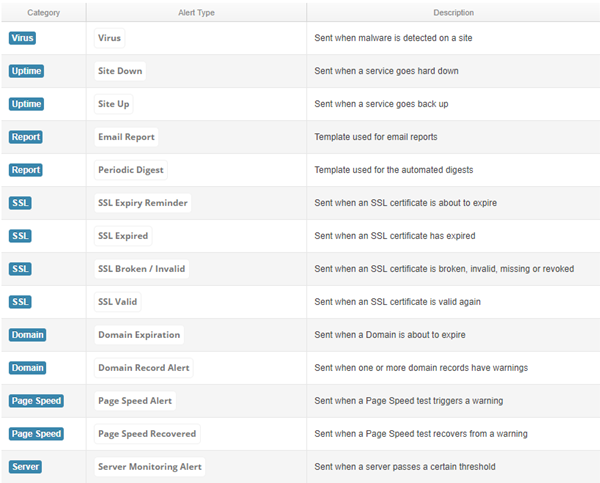
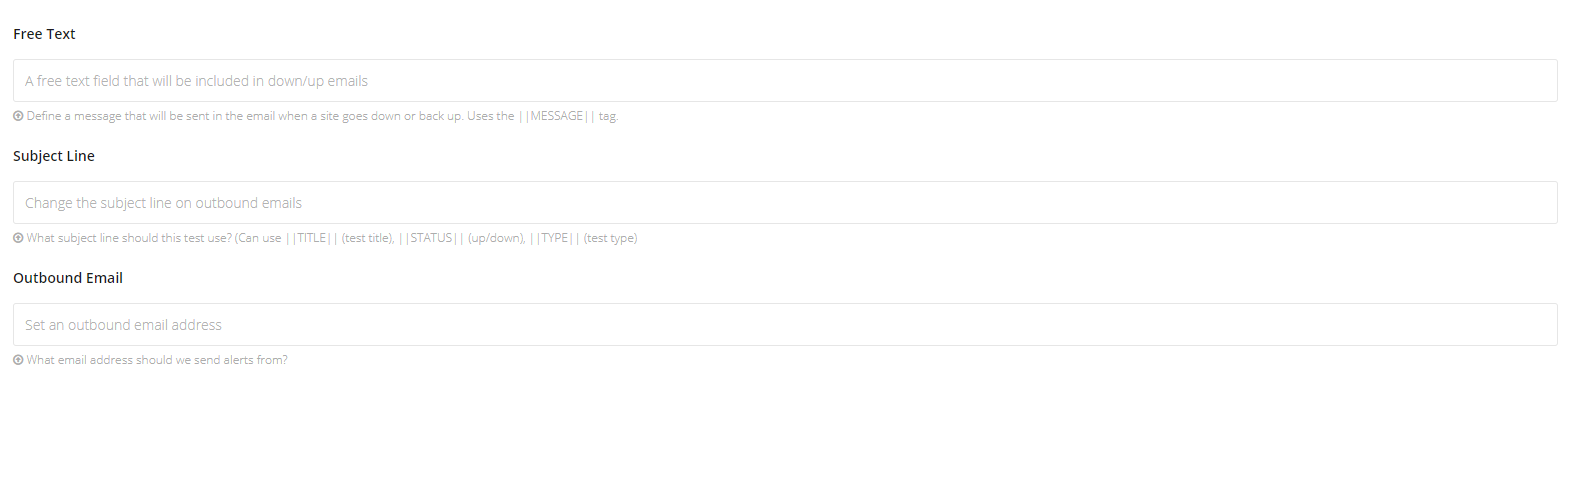
You can modify your alerts for Virus, Uptime, SSL, Domain, Page Speed, and Server type notifications in a range of different ways. Each template is managed individually and will apply to all notifications for the set type – you can also set test-specific changes up if there are tests that you’d rather not use the blanket default settings. For changes to all tests, you should go to the User Details section for setup, and for changes on an individual test level it’s just a case of editing the test in question and working with the three fields shown below:
When editing the email’s in the User Details section you’ll be able to change colors, logos, and even the base HTML/CSS of the email. We’ve included a range of tags which can be included in the code which will grab data which can make these emails more useful and tailored to your team.
| Tag | Usage |
|---|---|
| ||TITLE|| | Displays Test Name |
| ||SITE|| | Displays Website URL |
| ||TYPE|| | Displays Test Type (HTTP/PING/DNS etc) |
| ||QUOTE|| | TestID and alert number e.g ( 12345 – 1) |
| ||REASON|| | Display Cause of Downtime |
| ||TIME|| | Display total downtime length for test |
| ||HTTPCODE|| | Display the error Status Code |
| ||TESTID|| | Display the TestID on it’s own |
| ||CHECKRATE|| | Display how often the test is checked. |
| ||HOST|| | Display Hosting provider if present |
| ||CONFIRMEDTOTAL|| | Show Number of confirmations for downtime |
| ||MESSAGE|| | Display custom content set per test |
| ||TAGS|| | Include tags attributed to the test |
| ||VALID_FROM|| | Display the date from which the SSL certificate is valid (SSL only) |
| ||VALID_UNTIL|| | Display the date from which the SSL certificate is no longer valid (SSL only) |
So for example, you could populate the subject field of the alert email with these tags, something like “Your Site: ||TITLE|| Is Currently Down 533 ||REASON||”
Reports will work slightly differently in that they are showing a historic downtime record for one or more tests, we can fully edit these as well in terms of appearance, title, sender address and tags, and changes will apply both to automatically and manually generated reports.
We use a different set of tags here which can be seen in the table below, bear in mind that these are report specific and will not work for alert type notifications.
| Tag | Usage |
|---|---|
| ||CU|| | Display Total Uptime percentage for tests in report |
| ||WD|| | Display Number of Tests with downtime |
| ||WOD|| | Display Number of Tests with no downtime |
| ||TABLE|| | Display Table of Tests with downtime |
| ||UPTABLE|| | Display Table of Tests with no downtime |
If you’ve got questions on this or would like to know more, feel free to get in touch with our friendly support team who will gladly answer any questions you have!
